
Insights · Rent roll · July 2026 · 5 min
Loss to Lease: the Number the Seller Typed Himself.
In place rents are 100 dollars under market, which is upside. The first half of that sentence is usually true. The second half is a claim to check.
In place rents are 100 dollars under market, which is upside. The first half of that sentence is usually true. The second half is a claim to check.
Every value-add offering memorandum has the same sentence in it. In place rents are 100 dollars under market, which is upside. The first half of the sentence is usually true. The second half is a claim, and the difference between the two is where deals get overpaid for. Loss to lease is the most seller-friendly number in the package because the seller controls both of its inputs: he typed the in place rents into the rent roll and he typed the market rents into the assumption cell next to them. Nobody audits the assumption cell. The model should.
The definition is simple. Loss to lease is the gap between what the rent roll collects today and what the same units would collect at market rents, stated as dollars per year. The mistake is treating it as a number. It is not a number. It is a schedule, because rent does not reprice when the market moves. It reprices when a lease ends, one lease at a time, and the expiration schedule decides when each dollar of the gap becomes collectible. The money hides or disappears in that schedule.
Take 120 units, in place average 1,150 a month, market 1,250. The gap is 100 dollars a unit, which is 144,000 dollars a year, and at a 6.0 cap somebody will print that as 2.4 million of value in a deal summary. Here is what actually happens to it, one haircut at a time.
Haircut one is timing. At 45 percent annual turnover, about 54 of the 120 leases roll in year one. Those 54 units repricing at the full 100 dollar spread put 64,800 of the 144,000 on the run rate by the end of the year, roughly half the headline. The other 66 leases have every right to renew slowly, and renewal spreads are almost always thinner than new lease spreads, because a renewal is a negotiation with someone who knows what moving costs.
Haircut two is the calendar. Units do not all turn on January 1. They turn all year, so on average each repriced lease pays the new rent for about half of year one. The 64,800 run rate becomes 32,400 of actual year one cash.
Haircut three is the cost of the turn. Each turn carries downtime while the unit is made ready and re-leased, call it 625 dollars a turn, roughly half a month of the new rent. Across 54 turns that is 33,750. Put it next to the 32,400 of incremental cash and read it again: in year one, the program that is working exactly as underwritten produces minus 1,350 of incremental cash before a dollar of make-ready. Add the make-ready itself, the capital that earned the 100 dollar bump, at an assumed 2,500 a door, and year one is 136,350 out of pocket. None of that makes the deal bad. It makes year one of a value-add plan a cost, not a harvest, and a model that books the rent bump without the turn cost is writing fiction with good formatting.
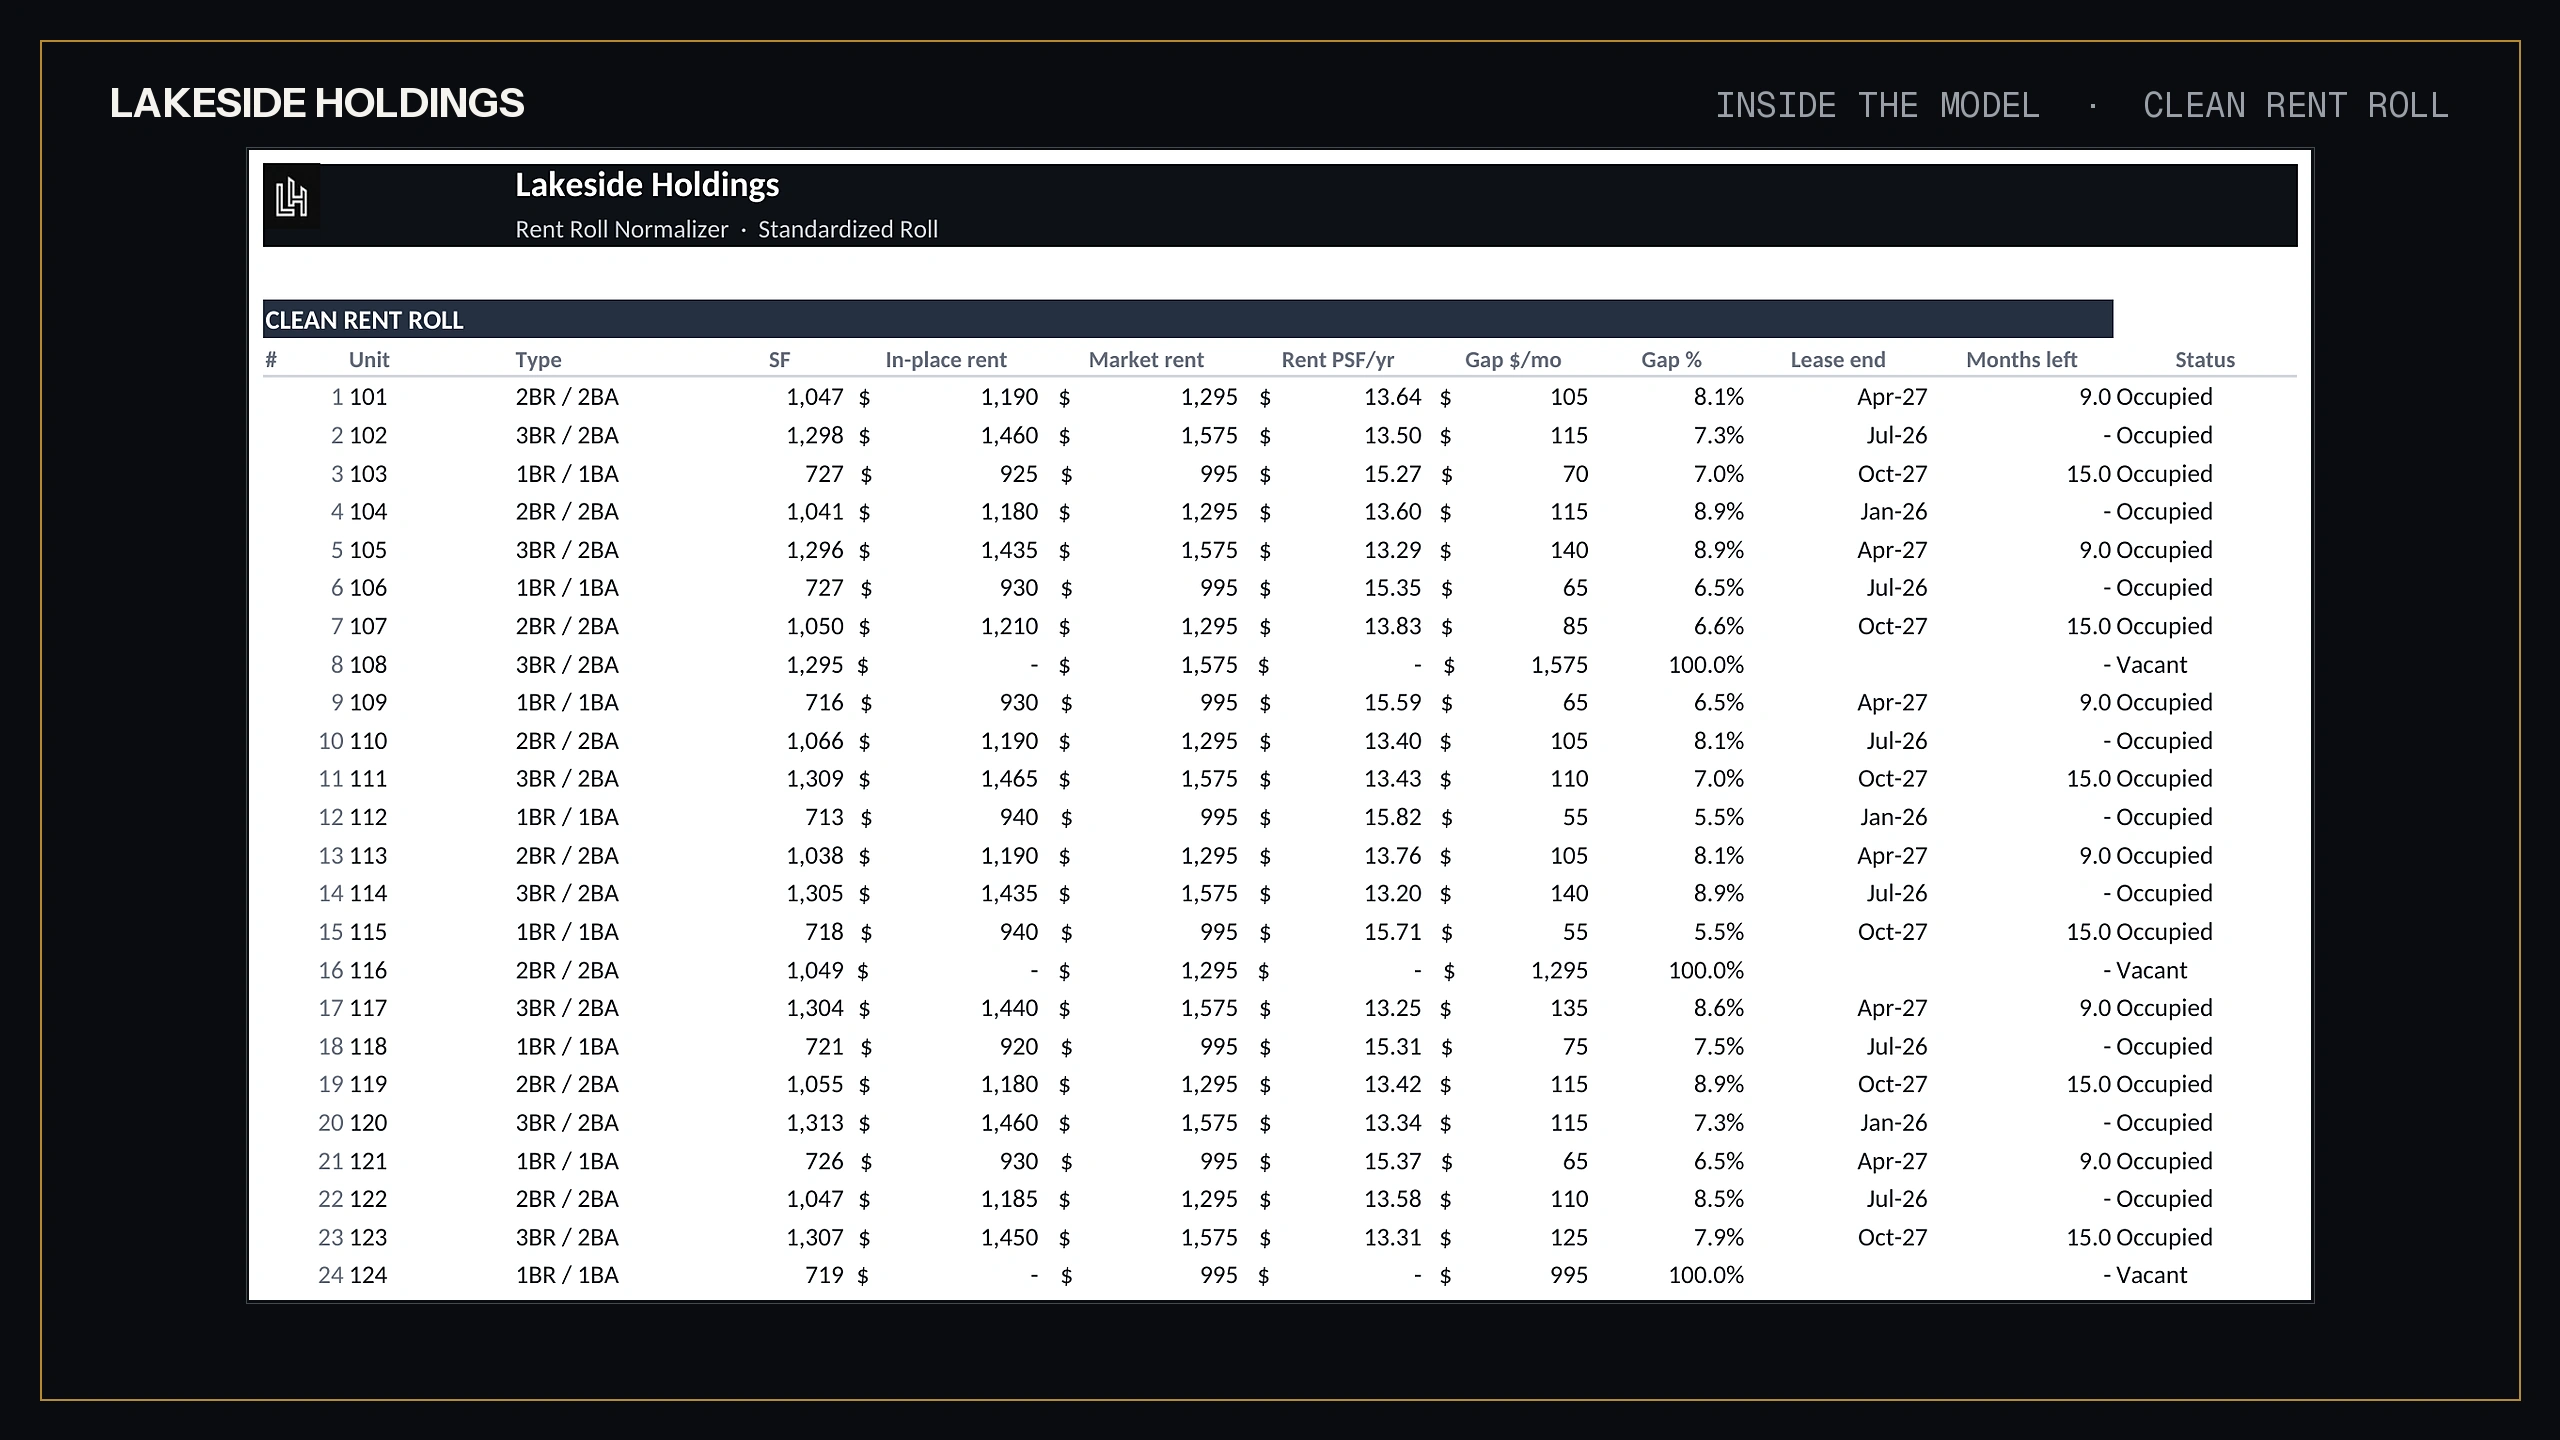
Run the turnover math forward and the schedule gets honest. By the end of year two roughly 84 units have rolled and the captured run rate is 100,800. By the end of year three it is about 100 units and 120,000, still short of the 144,000 headline, because turnover compounds against a shrinking pool of old leases. Value follows the same schedule. The 64,800 captured in year one supports about 1.08 million at the same 6.0 cap, against the 2.4 million the deal summary printed on day one. The rest is real only if the next two years of expirations, renewal spreads and turn costs deliver it. A buyer paying for the full 2.4 million on day one is paying today for work the seller has not done, with the buyer's own capital.
The discipline fits in three questions. First, what does the actual expiration schedule say reprices in each of the next three years, not what does an average turnover assumption say. A rent roll where half the leases expire next quarter is a different deal from one where they expire evenly, at the same headline loss to lease. Second, what renewal spread are you underwriting versus new lease spread, and can you defend the split with the trade-out history rather than the broker's sentence. Third, what do downtime and make-ready cost per turn, because the rent bump is revenue and the turn is a cost, and they arrive together or not at all.
Answering those three requires the rent roll itself, normalized unit by unit, which is why the first step is always to analyze the rent roll before the assumption cells get any respect. The loss to lease claim also sits one line above its cousin, the gap between physical and economic occupancy, which deserves the same skepticism for the same reason. Our Rent Roll Normalizer computes loss to lease from the actual expiration schedule, unit by unit, which is the difference between underwriting the claim and repeating it. When we audit a model, the loss to lease line is checked the same way everything else is, rebuilt in a second engine and reconciled to source, and every model we publish is verified against an independent replica before release.
Before you credit the upside, state it as a sentence: "This rent roll reprices this many units in the next twelve months, at this spread, at this cost per turn, for this many incremental dollars." If you can finish that sentence from the expiration schedule, the upside is underwriting. If you can only finish it from the deal summary, it is marketing. The free screener and the models are on the site.
The seller typed the number. The model decides the deal.
We use an essential cookie to remember your preferences and privacy-first analytics that collect no personal data. By continuing you accept our Cookies Policy.We use one essential cookie and privacy-first analytics. Read the Cookies Policy.